分布式链路追踪
使用 Brave + Zipkin 进行分布式链路追踪
介绍一下涉及的关键词
Micrometer 是一个用于 度量(Metrics) 的库,广泛用于在分布式系统中收集和导出应用程序的性能指标。它是 Spring Boot 和 Spring Cloud 的默认监控库,同时也是支持多种监控后端的通用度量库。它可以帮助开发者追踪应用程序的运行状态,包括 CPU 使用率、内存占用、垃圾回收信息、HTTP 请求延迟等关键信息。
Brave 是一个专注于 Java 的分布式追踪库,最初由 Twitter 开发,是 Zipkin 生态系统的一部分。它用于在分布式环境中生成和收集追踪数据,帮助开发者分析请求在不同服务之间的传播路径。
Zipkin 是一个分布式链路追踪系统,最初由 Twitter 开发,并贡献给了开源社区。它专门用于收集、存储和展示分布式系统中的请求链路数据,帮助开发者分析和定位性能瓶颈以及故障原因。在微服务架构中,一次请求通常会经过多个服务或组件,Zipkin 通过在这些服务之间传播 Trace 和 Span,完整地记录请求的执行路径和耗时情况。
🚀 Zipkin 的工作原理
Zipkin 的工作流大致分为四个阶段:
- Instrumentation(数据采集)
- 使用像 Brave(Java)或 OpenTelemetry 等库在应用中植入追踪代码,记录请求的 Trace 和 Span 数据。
- Transport(数据传输)
- 采集的追踪数据通过 HTTP、Kafka 或 RabbitMQ 等方式发送到 Zipkin Server。
- Storage(数据存储)
- Zipkin 支持多种存储后端,如 Elasticsearch、MySQL、Cassandra 等。
- UI 展示和分析
- Zipkin 提供了一个 Web UI,可视化展示完整的 Trace 信息,帮助开发者快速定位性能瓶颈。
基础配置
添加依赖
添加依赖管理器
xml
<!-- 依赖管理 -->
<dependencyManagement>
    <dependencies>
        <dependency>
            <groupId>org.springframework.boot</groupId>
            <artifactId>spring-boot-dependencies</artifactId>
            <version>${spring-boot.version}</version>
            <type>pom</type>
            <scope>import</scope>
        </dependency>
        <dependency>
            <groupId>org.springframework.cloud</groupId>
            <artifactId>spring-cloud-dependencies</artifactId>
            <version>${spring-cloud.version}</version>
            <type>pom</type>
            <scope>import</scope>
        </dependency>
        <dependency>
            <groupId>com.alibaba.cloud</groupId>
            <artifactId>spring-cloud-alibaba-dependencies</artifactId>
            <version>${spring-cloud-alibaba.version}</version>
            <type>pom</type>
            <scope>import</scope>
        </dependency>
        <dependency>
            <groupId>org.apache.dubbo</groupId>
            <artifactId>dubbo-bom</artifactId>
            <version>${dubbo.version}</version>
            <type>pom</type>
            <scope>import</scope>
        </dependency>
    </dependencies>
</dependencyManagement>添加依赖
xml
<dependencies>
    <!-- Micrometer Tracing -->
    <dependency>
        <groupId>io.micrometer</groupId>
        <artifactId>micrometer-tracing</artifactId>
    </dependency>

    <!-- Brave(用于 Zipkin 集成) -->
    <dependency>
        <groupId>io.micrometer</groupId>
        <artifactId>micrometer-tracing-bridge-brave</artifactId>
    </dependency>

    <!-- Zipkin Reporter -->
    <dependency>
        <groupId>io.zipkin.reporter2</groupId>
        <artifactId>zipkin-reporter-brave</artifactId>
    </dependency>

    <!-- Spring Boot Actuator(提供追踪端点) -->
    <dependency>
        <groupId>org.springframework.boot</groupId>
        <artifactId>spring-boot-starter-actuator</artifactId>
    </dependency>
</dependencies>编辑配置
yaml
---
# 分布式追踪配置
management:
  zipkin:
    tracing:
      endpoint: http://192.168.1.10:38646/api/v2/spans
  tracing:
    sampling:
probability: 1.0使用追踪
集成网关
调用接口后查看日志的 traceId 和 spanId
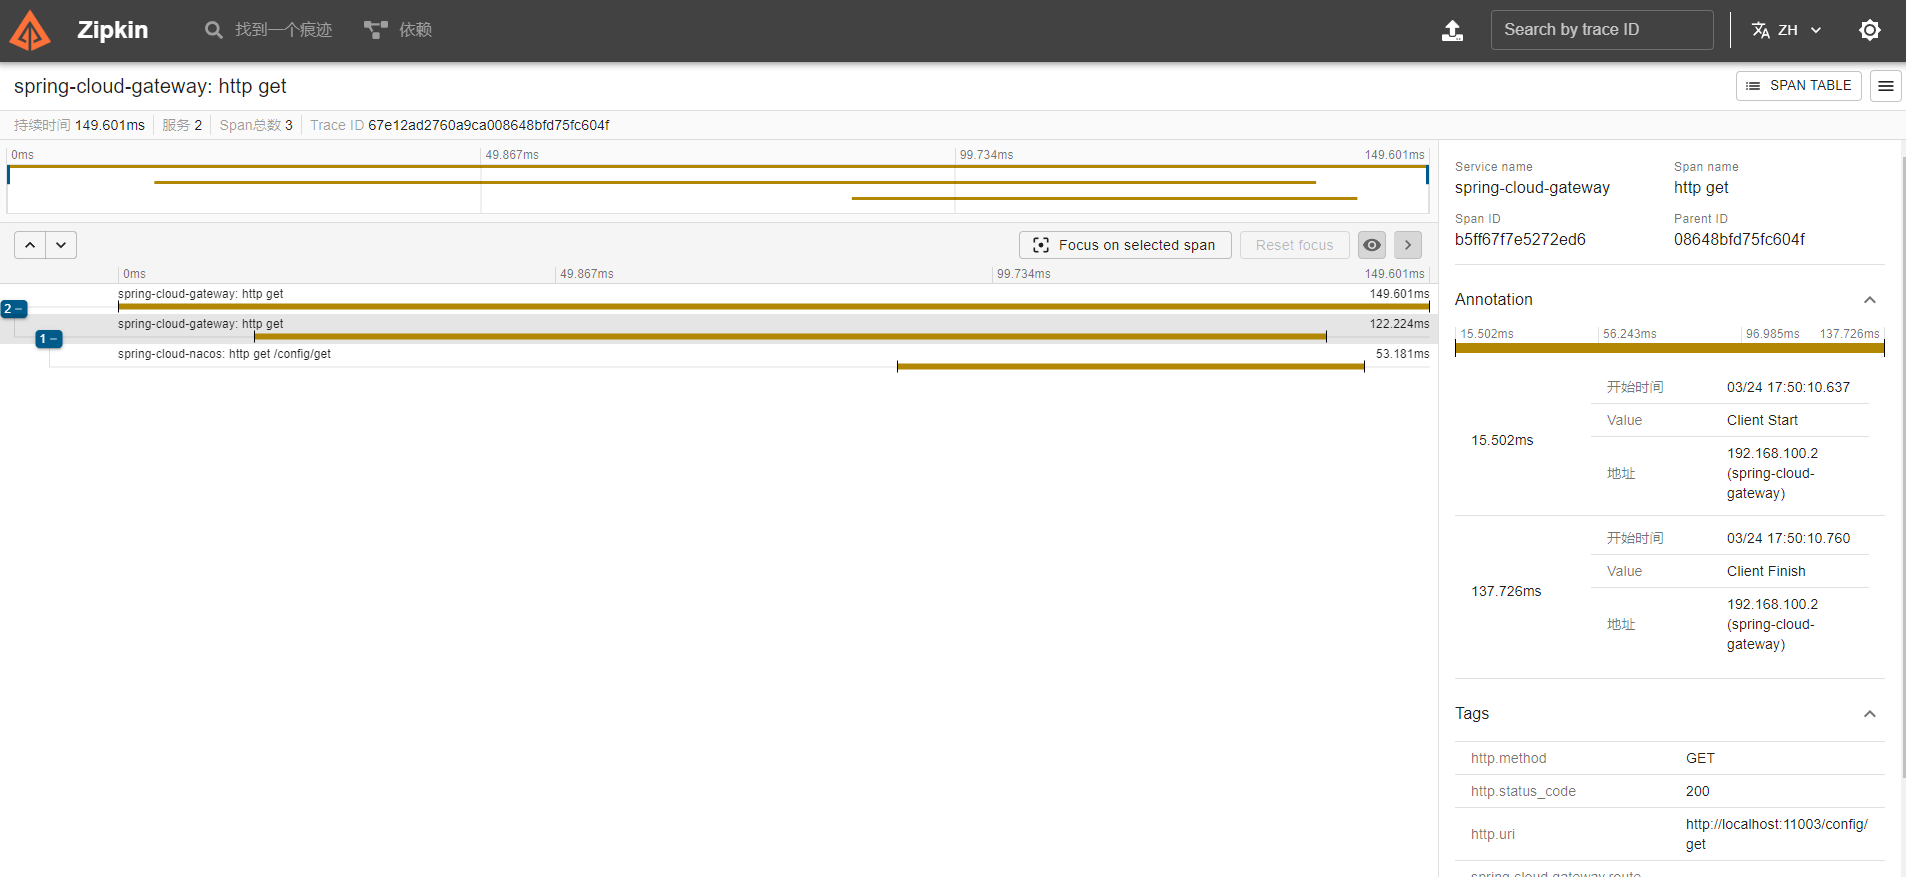
查看 zipkin 的链路信息